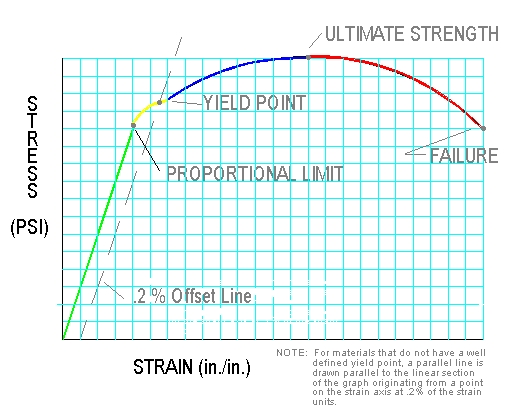
| A
helpful diagram for understanding the behavior or a material is the
stress-strain diagram. There are several properties that can be observed
or estimated using a stress strain diagram including:
* Proportional
Limit - The linear or elastic portion of the graph
* Yield Strength
- The upper limit of the elastic range (beyond this
point the
material is permanently deformed and
becomes plastic)
* Ultimate
Strength - The maximum stress that the material can
withstand
* Fracture
Strength - The Stress where the material breaks
* Elongation (Ductility)
- How much a material stretches (strains)
under a
given load
* Modulus
of Elasticity (Stiffness) - The stress(S) to strain(n) ratio
within the
elastic range (the linear section of
the graph). E=S/n |