| ECON 232 Chapter 8 MACROECONOMIC INSTABILITY: UNEMPLOYMENT AND INFLATION |
| This chapter previews economic growth, the business cycle, unemployment,
and inflation. It sets the stage for the analytical presentation
in later chapters.
Economic growth is defined and the arithmetic and sources of economic
growth are examined. The record of growth in the U.S. is viewed from
several perspectives including an international comparison in Global Perspective.
The business cycle is introduced in historical perspective and is presented
in stylized form (Figure 8?1). While hinting at various business
cycle theories, the authors stress the general belief that changes in aggregate
spending, especially durable goods and investment spending, are the immediate
cause of economic instability. Non-cyclical fluctuations are also
treated briefly before the analysis of unemployment and inflation.
In the section on unemployment, the various types of unemploymentfrictional,
structural, and cyclicalare described. Then the problems involved
in measuring unemployment and in defining the full?employment unemployment
rate are considered. The economic and non-economic costs of unemployment
are presented, and finally, Global Perspective 8-2 gives an international
comparison of unemployment rates.
Inflation is accorded a rather detailed treatment from both a cause
and an effect perspective. International comparisons of inflation
rates in the post-1983 period are given in Global Perspective 8-3.
Demand?pull and cost?push inflation are described. Considerable emphasis
is placed on the fact that the redistributive effects of inflation will
differ, depending on whether inflation is anticipated or unanticipated.
The chapter ends with historical cases of extreme inflation to remind students
that inflationary fears have some basis in fact. |
| I. Introduction: This chapter provides an introductory
look at trends of real GDP growth and the macroeconomic problems of the
business cycle, unemployment and inflation. |
II. Economic Growth-how to increase the economys
productive capacity over time.
A. Two definitions of economics growth are given.
1. The increase in real GDP, which occurs over a period of time.
2. The increase in real GDP per capita, which occurs over time.
This definition is superior if comparison of living standards is desired.
For example, Chinas GDP is $744 billion compared to Denmarks $155 billion,
but per capita GDPs are $620 and $29,890 respectively.
B. Growth is an important economic goal because it means more material
abundance and ability to meet the economizing problem. Growth lessens
the burden of scarcity.
C. The arithmetic of growth is impressive. Using the rule of
70, a growth rate of 2 percent annually would take 35 years for GDP to
double, but a growth rate of 4 percent annually would only take about 18
years for GDP to double. (The rule of 70 uses the absolute value
of a rate of change, divides it into 70, and the result is the number of
years it takes the underlying quantity to double.)
D. Main sources of growth are increasing inputs or increasing productivity
of existing inputs.
1. About one-third of U.S. growth comes from more inputs.
2. About two-thirds comes from increased productivity.
E. Growth Record of the United States (Table 8-1) is impressive.
1. Real GDP has increased more than sixfold since 1940, and real
per capita GDP has risen almost fourfold. (See columns 2 and 4, Table
8-1)
2. Rate of growth record shows that real GDP has grown 3.1 percent
per year since 1950 and real GDP per capita has grown about 2 percent per
year. But the arithmetic needs to be qualified.
a. Growth doesnt measure quality improvements.
b. Growth doesnt measure increased leisure time.
c. Growth doesnt take into account adverse effects on environment
or human security.
d. International comparisons are useful in evaluating U.S. performance.
For example, Japan grew more than twice as fast as U.S. until the 1990s
when the U.S. far surpassed Japan. (see Global Perspective 8-1).
|
 The NRA was part of the Roosevelt administration's efforts to respond
to the Great Depression. The National Industrial Recovery Act set
up the National Recovery Administration, in which participating firms agreed
to fix prices at higher than market levels in an effort to enable the firms
to support higher levels of employment. The NRA was declared unconstitutional
by the Supreme Court.
The NRA was part of the Roosevelt administration's efforts to respond
to the Great Depression. The National Industrial Recovery Act set
up the National Recovery Administration, in which participating firms agreed
to fix prices at higher than market levels in an effort to enable the firms
to support higher levels of employment. The NRA was declared unconstitutional
by the Supreme Court. |
III. Overview of the Business Cycle
A. Historical record:
1. The United States impressive long-run economic growth has been
interrupted by periods of instability.
2. Uneven growth has been the pattern, with inflation often accompanying
rapid growth, and declines in employment and output during periods of recession
and depression (see Figure 8?1 and Table 8-2).
B. Four phases of the business cycle are identified over a several-year
period. (See Figure 8-1)
1. A peak is when business activity reaches a temporary maximum with
full employment and near-capacity output.
2. A recession is a decline in total output, income, employment, and
trade lasting six months or more.
3. The trough is the bottom of the recession period.
4. Recovery is when output and employment are expanding toward full?employment
level.
C. There are several theories about causation.
1. Major innovations may trigger new investment and/or consumption
spending.
2. Changes in productivity may be a related cause.
3. Most agree that the level of aggregate spending is important, especially
changes on capital goods and consumer durables.
D. Cyclical fluctuations: Durable goods output is more unstable
than non-durables and services because spending on latter usually cannot
be postponed.
|
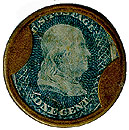 A Civil-War era postage stamp used as money in a brass or copper cover.
Because of high inflation, people hoarded coins for their metal value.
The U.S. Treasury attempted to satisfy the need for money with paper fractional
currency. Private business people bought postage stamp covers, with
an advertisement for their business on the back, to protect stamps
used to make change. The public's need for money was partly satisfied,
and the businesses benefited from the advertising.
A Civil-War era postage stamp used as money in a brass or copper cover.
Because of high inflation, people hoarded coins for their metal value.
The U.S. Treasury attempted to satisfy the need for money with paper fractional
currency. Private business people bought postage stamp covers, with
an advertisement for their business on the back, to protect stamps
used to make change. The public's need for money was partly satisfied,
and the businesses benefited from the advertising. |
IV. Unemployment (One Result of Economic Downturns)
A. Types of unemployment:
1. Frictional unemployment consists of those searching for jobs
or waiting to take jobs soon; it is regarded as somewhat desirable, because
it indicates that there is mobility as people change or seek jobs.
2. Structural unemployment: due to changes in the structure
of demand for labor; e.g., when certain skills become obsolete or geographic
distribution of jobs changes.
a. Glass blowers were replaced by bottle-making machines.
b. Oil-field workers were displaced when oil demand fell in 1980s.
c. Airline mergers displaced many airline workers in 1980s.
d. Foreign competition has led to downsizing in U.S. industry and loss
of jobs.
e. Military cutbacks have led to displacement of workers in military-related
industries.
3. Cyclical unemployment is caused by the recession phase of
the business cycle, which is sometimes called deficient demand unemployment.
B. Definition of Full Employment
1. Full employment does not mean zero unemployment.
2. The full?employment unemployment rate is equal to the total frictional
and structural unemployment.
3. The full?employment rate of unemployment is also referred to as
the natural rate of unemployment.
4. The natural rate is achieved when labor markets are in balance;
the number of job seekers equals the number of job vacancies. At
this point the economys potential output is being achieved. The
natural rate of unemployment is not fixed, but depends on the demographic
makeup of the labor force and the laws and customs of the nations.
The recent drop in the natural rate from 6% to 5.5% has occurred mainly
because of the aging of the work force and increased competition in product
and labor markets.
5. The natural rate of unemployment is not fixed but depends on the
demographic makeup of the labor force and the laws and customs of the nations.
6. The recent drop in the natural rate of 6% to 5.5% has occurred mainly
because of the aging of the work force and increased competition in product
and labor markets.
C. Measuring unemployment (see Figure 8-4 for 1994):
1. The population is divided into three groups: those under age
16 or institutionalized, those not in labor force, and the labor force
that includes those age 16 and over who are willing and able to work.
2. The unemployment rate is defined as the percentage of the labor
force that is not employed.
3. The unemployment rate is calculated by random survey of 60,000 households
nationwide.
a. Part?time workers are counted as employed.
b. Discouraged workers who want a job, but are not actively seeking
one, are not counted as being in the labor force, so they are not part
of unemployment statistic.
D. Economic cost of unemployment:
1. GDP gap and Okuns Law: GDP gap is the difference between
potential and actual GDP. (See Figure 8-5) Economist Okun quantified
relationship between unemployment and GDP as follows: For every
1 percent of unemployment above the natural rate, a 2 percent GDP gap occurs.
This has become known as Okuns law.
2. Unequal burdens of unemployment exist. (See Table 8-2)
a. Rates are lower for white-collar workers.
b. Teenagers have the highest rates.
c. Blacks have higher rates than whites.
d. Rates for males and females are comparable, though females had a
lower rate in 1992.
e. Less educated workers, on average, have higher unemployment rates
than workers with more education.
f. Long-term (15 weeks or more) unemployment rate is much lower than
the overall rate.
E. Noneconomic costs include loss of self-respect and social and political
unrest.
F. International comparisons. (See Global Perspective 8-1)
Foreign countries usually have higer unemployment rates than the U.S.
For industrialized countries, this is partly attributable to the higher
level of unemployment and social benefits workers receive in those countries.
|
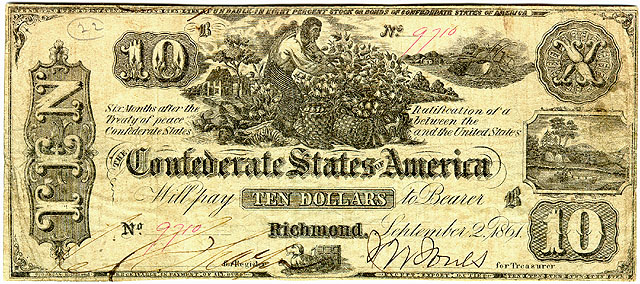 This Confederate ten dollar note promised to pay eight percent interest,
intended to offset the high inflation experienced during the Civil War.
The note was not redeemable on demand, but was supposed to be payable six
months after the ratification of a peace treaty between the Confederate
States and the United States. The Confederate government accepted
these notes in payment for all taxes, except export duties which could
only be paid in gold or foreign currency. The inflation rate soon
exceeded eight percent, and these notes quickly became worthless.
Note the hand-written serial number and signatures. The September
2, 1861 date is the date of the authorizing legislation, not the actual
date of issue, though judging from the serial number, this note was probably
issued fairly early in the war.
This Confederate ten dollar note promised to pay eight percent interest,
intended to offset the high inflation experienced during the Civil War.
The note was not redeemable on demand, but was supposed to be payable six
months after the ratification of a peace treaty between the Confederate
States and the United States. The Confederate government accepted
these notes in payment for all taxes, except export duties which could
only be paid in gold or foreign currency. The inflation rate soon
exceeded eight percent, and these notes quickly became worthless.
Note the hand-written serial number and signatures. The September
2, 1861 date is the date of the authorizing legislation, not the actual
date of issue, though judging from the serial number, this note was probably
issued fairly early in the war. |
V. Inflation: Defined and Measured
A. Definition: Inflation is a rising general level of
prices (not all prices rise at the same rate, and some may fall).
A mathematical definition of inflation is the percent increase in a measure
of the price level, such as the CPI or GDP deflator, from one year to the
next.
B. To measure inflation, subtract last years price index from this
years price index and divide by last years index; then multiply by 100
to express as a percentage.
C. Rule of 70 permits quick calculation of the time it takes the price
level to double: Divide 70 by the percent rate of inflation and the
result is the approximate number of years for the price level to double.
If the inflation rate is 10 percent, then it will take about ten years
for prices to double. (Note: You can also use this rule to calculate
how long it takes savings to double at a given compounded interest rate.)
D. Facts of inflation:
1. In the past, deflation has been as much a problem as inflation.
For example, the 1930s depression was a period of declining prices and
wages.
2. All industrial nations have experienced the problem (see Global
Perspective 8-2).
3. Some nations experience astronomical rates of inflation (Angolas
was 4,145 percent in 1996).
4. The inside covers of the text contain historical rates for the U.S.
E. Causes and theories of inflation:
1. Demand-pull inflation: Spending increases faster than production.
(See Figure 8-7) Inflation will occur in range 2 and range 3 of this
illustration. Bottlenecks occur in some industries in range 2, and
output cannot expand to meet demand in these industries so producers raise
prices; in Range 3 full employment has been reached and resource prices
will rise with increasing demand, causing producers to raise prices.
Note: Chapter 7s distinction between nominal and real GDP is helpful
here.
2. Cost-push or supply-side inflation: Prices rise because of
rise in per-unit production costs (Unit cost = total input cost/units of
output).
a. Wage-push can occur as result of union strength.
b. Supply shocks may occur with unexpected increases in the price of
raw materials.
3. Complexities: It is difficult to distinguish between demand-pull
and cost-push causes of inflation, although cost-push will die out in a
recession if spending does not also rise.
|
|
VI. Redistributive effects of inflation:
A. Fixed-income groups will be hurt because their real income
suffers. Their nominal income does not rise with prices.
B. Savers will be hurt by unanticipated inflation, because interest
rate returns may not cover the cost of inflation. Their savings will
lose purchasing power.
C. Debtors (borrowers) can be helped and lenders hurt by unanticipated
inflation. Interest payments may be less than the inflation rate,
so borrowers receive dear money and are paying back cheap dollars that
have less purchasing power for the lender.
D. If inflation is anticipated, the effects of inflation may be less
severe, since wage and pension contracts may have inflation clauses built
in, and interest rates will be high enough to cover the cost of inflation
to savers and lenders.
1. Inflation premium is amount that interest rate is raised to cover
effects of anticipated inflation.
2. Real interest rate is defined as nominal rate minus inflation
premium. (See Figure 8-6)
E. Final points
1. Unexpected deflation, a decline in price level, will have the opposite
effect of unexpected inflation.
2. Many families are simultaneously helped and hurt by inflation because
they are both borrowers and earners and savers.
3. Effects of inflation are arbitrary, regardless of societys goals.
4. See Quick Review 8-4.
|

|
VII. Output Effects of Inflation
A. Cost-push inflation, where resource prices rise unexpectedly,
could cause both output and employment to decline. Real income falls.
B. Mild inflation (<3%) has uncertain effects. It may be a
healthy by-product of a prosperous economy, or it may have an undesirable
impact on real income.
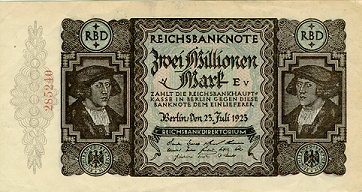
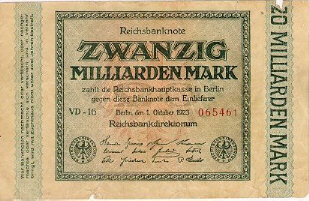
C. Danger of creeping inflation turning into hyperinflation, which can
cause speculation, reckless spending, and more inflation (see examples
in text of Hungary and Japan following World War II, and Germany following
World War I).
|
|
VIII. LAST WORD: The Stock Market and The
Economy:
How, if at all, do changes in stock prices relate to macroeconomic
stability?
A. Do changes in stock prices and stock market wealth cause
instability? The answer is yes, but usually the effect is weak.
1. There is a wealth effect: Consumer spending rises as asset
values rise and vice versa if stock prices decline substantially.
2. Also, there is an investment effect: Rising share prices lead
to more capital goods investment and the reverse in true for falling share
prices.
B. Stock market bubbles can hurt the economy by encouraging reckless
speculation with borrowed funds or savings needed for other purposes.
A crash can cause unwarranted pessimism about the underlying economy.
C. A related question concerns forecasting value of stock market averages.
Stock price averages are included as one of ten Leading Indicators used
to forecast the future direction of the economy. (See Last Word,
Chapter 12). However, by themselves, stock values are not a reliable
predictor of economic conditions.
|
