
THE
NORTH CAROLINA HUMAN DEVELOPMENT REPORT
Robert F. Mulligan, Ph.D.
Western Carolina University
Abstract
This paper computes and interprets Human Development Indices (HDIs) for the 100 counties of North Carolina. Human Development Indices include information on three dimensions: income, health, and education, and therefore provide a more balanced and complete assessment of well-being than measures of income alone. Per capita nominal income is used as the income measure. Physicians per 10,000 of population is the health measure. High-school completion is the measure of education. This paper discusses the Human Development Indices and how the North Carolina Human Development Indices (NCHDIs) may be used for needs and outcomes assessment. Human development measured by the NCHDI could be improved for particularly deprived counties by augmented levels of spending on income redistribution, education, and health care, but also by the residential migration economic development encourages with enhanced employment opportunity. Conversely, however, augmented spending intended to alleviated extreme variation in the NCHDI across counties would necessarily prove fruitless, and perhaps counterproductive, if it results in the most desirable and productive workers migrating out of the deprived counties to those with more attractive economic opportunities.
Introduction
This paper applies the methodology of the United Nations Development Programme’s (UNDP) Human Development Report (UNDP 1990-) to calculate North Carolina Human Development Indices (NCHDIs) for the 100 counties of North Carolina. Traditional indices of economic development, such as per capita income, employment, and population fail to provide a broader measure of a region’s performance. The UNDP HDI measure incorporates such other significant factors as health and literacy. The HDI is an alternative measure of economic growth and development used to assess broader economic development performance than can be assessed through income measures alone (Cortes 1999; Kaminarides and Nissan 1999).
This paper calculates HDIs for the 100 counties of North Carolina using the UNDP methodology. NCHDIs provide a measure of relative, though not absolute, local economic development and allow observation of the distribution of development throughout the state. This distribution is essential for targeting economic development initiatives in the most deprived counties, as well as targeting the kind of development necessary. In addition, NCHDIs can be used over time to assess the success of development initiatives and the impact of tax and fiscal policy. The UNDP computes HDIs for UN member states based on measures of per capita income, life expectancy, and literacy. Because life expectancy estimates are not available for North Carolina at the county level, an alternative measure of health was used, physicians per 10,000 of population. When life expectancy data are unavailable or are not sufficiently current, the UNDP normally uses hospital beds per 1000 population to proxy life expectancy, but since NC county-wide data are available for licensed physicians per 10,000 population, and since this is more informative than hospital beds and less likely to be biased by the distribution of hospital facilities, this was used as the health measure. The normal measure of education is adult literacy, which is available for North Carolina at the county level (Siedow 1998), but the data are not current. The percentage of the 25 and over population which have completed high school or the equivalent was used instead.
NCHDIs are essential for evaluating the distribution of income, health, and education impacts across the state. For example, revenue enhancement or redistribution policies should be evaluated not only through their direct impact on the income measure, but through less direct impacts through education and health measures. Spending on health, education, and other government services should be evaluated based on the need as indicated in a broad measure of well-being, such as the NCHDI, as well as on the impact over time in improving NCHDIs for the most deprived counties.
Theory: The UNDP Human Development Indices
The UNDP calculates a deprivation ratio for each nation, for each of the three development dimensions of income, health, and education:
Dik = (Zkmax – Zik)/(Zkmax – Zkmin),
where i = 1,n refers to the n nations included in the UNDP Human Development Report and k = 1,3 refers to the three development dimensions. Zkmax and Zkmin refer to the maximum and minimum values for each of the three development variables within the dataset including all countries.
For income, a nation's deprivation ratio is the fraction of the difference between that nation's per capita income and that for the country with the highest income measure, divided by the maximum difference, which is the difference between the income for the richest nation and the poorest. Health and education deprivation ratios are calculated in the same way.
The UNDP uses the most obviously straightforward and readily available statistics to calculate the deprivation ratios. Per capita income in U.S. dollars is used to measure income; mean life expectancy in years is used to measure health; mean literacy as a percent of the adult population is used to measure education.
Alternative measures for the three dimensions can be used as long as the alternative measure is available for all the geographical units in the study. Often the UNDP uses hospital beds per 1000 population in place of life expectancy. This consideration is important in implementing HDI methodology to smaller units, including states or provinces, counties, towns, or municipalities. Smaller geographic units may not have current average income, life expectancy, or literacy statistics available.
The average deprivation ratio is computed for each nation as:
Di = (Di1 + Di2 + Di3)/3.
Finally, the Human Development Index is calculated as simply the difference between one and Di:
HDIi = 1 – Di.
The higher the HDI, the better a county performs relative to others in terms of the three criteria of income, health, and education.
The UNDP has provided human development indices for nations in its annual Human Development Report since 1990. A major limitation of this overall combined measure is that it does not reflect variations or disparities among different groups within a country: e.g., regions, states, or provinces; urban v. rural areas; males v. females; or different ethnic or demographic groups.
Adapting UNDP's HDI Methodology to Problems of
Community Development Analysis
This paper calculates HDIs for the 100 counties of North Carolina using the UNDP methodology. HDIs provide a measure of local economic development and allow observation of the distribution of development throughout the state.
The HDI is calculated based on measures of per capita income, life expectancy, and literacy. Because life expectancy is not available for North Carolina at the county level, an alternative measure of health was used. County-wide data are available for licensed physicians per 10,000 population (NCDHHS 1997). This was used in place of life expectancy.
A deprivation ratio is computed for each county, for each of the three development dimensions of income, health, and education:
Dik = (Zkmax – Zik)/(Zkmax – Zkmin),
where i = 1,100 refers to the 100 NC counties and k = 1,3 refers to the three development dimensions. Zkmax and Zkmin refer to the maximum and minimum values for each of the three development variables. The average deprivation ratio is computed for each county as:
Di = (Di1 + Di2 + Di3)/3.
Finally, the Human Development Index is calculated as simply the difference between one and Di:
HDIi = 1 – Di.
The higher the HDI, the better a county performs relative to others in terms of the three criteria of income, health, and education.
The UNDP has provided human development indices for nations in its annual Human Development Report since 1990. A major limitation of this overall combined measure is that it does not reflect variations or disparities among different groups within a country: e.g., regions, states, or provinces; urban v. rural areas; males v. females; or different ethnic or demographic groups.
North Carolina County-level Data
All the data used to
compute NCHDIs was taken from the 2000 census (U.S. Census Bureau 2006).
Income
Although county-level income data is generally available for the U.S., it may not be for other countries, or for smaller geographic subdivisions. Generally speaking, any per capita measure of income or employment is an appropriate proxy, as long as the same variable is observed for each unit under study.
Income measures may be adjusted for inflation or not. Ideally, since the costs of living in different counties change differently, if inflation were measured at the county level, it would be desirable to use inflation adjusted (or "real") data. Although the U.S. Bureau of Labor Statistics of computes urban CPIs for Charlotte and Raleigh, different price measures are generally not available for each county. Consequently, the income measure used for North Carolina was per capita nominal income in 1999, which is not adjusted for inflation.
Health
The standard measure of health is life expectancy, which is available for individual states, but not generally for U.S. counties. The UNDP uses an alternative measure when life expectancy data are not available, hospital beds per 1000 population. This measure is appropriate for developing countries and national-level data, but would skew HDIs for U.S. counties (Conover 1998). A sparsely populated county with a large state health facility would rate very high, and heavily populated counties with fewer in-county medical institutions would rate very low. In addition, the relatively small size of North Carolina counties, laid out so that the county seats would never be more than one day's travel by horse, results in many citizens crossing county lines to visit their primary care physician, as well as regional hospitals serving several small counties.
The measure used here was licensed physicians per 10,000 population, taken from the 2000 census. Americans are more likely to leave their home county for hospitalization than for routine and maintenance medical care, so this measure appears to better reflect the actual state of health in the U.S.
Education
The UNDP normally measures education with the adult literacy rate. This is not generally available for all counties within a state, but several states have collected this data annually, and North Carolina collects it less frequently. The most recent literacy study was published by Siedow (1997), which provided estimated literacy rates for 97 counties. Three North Carolina counties, Camden, Hyde, and Tyrrell, had populations too small to estimate literacy meaningfully, so for these counties HDIs could have been calculated based on income and health alone. The 2000 census provides the percentage of the population 25 or older who have completed high school or the equivalent. This education measure was used because it is more current and equally meaningful.
North Carolina Human Development Indices
North Carolina HDIs are presented in table 1. Underlying data for each county are given in columns two (per capita income), four (physicians per 10,000 population), and six (high school completion rate). These data are used to compute deprivation ratios for the three development dimensions of income, health, and education, which are combined in the HDI given in column eight. Each county is ranked according to income, health, and education, and an overall rank based on the HDI is given in column nine.
Durham County ranks first in human development, but only ranks eighth in income ($23,156.00), second in health, and ninth in high school completion. Mecklenburg County, containing the city of Charlotte, ranks second in human development, though it ranks first in income ($27,352.00), ninth in health, and fifth in education. Yancy County ranks first in health, but sixty-fifth in income ($16,335.00), and sixty-second in education, and its overall human development rank is twelfth. Wake County ranks first in education, second in income ($27,004.00), eighty-fifth in health, and third overall.
TABLE 1NORTH CAROLINA HUMAN
DEVELOPMENT INDICES |
||||||||
|
NC County |
Per capita income (1999) |
Income Rank |
Physicians per 10,000 |
Health Rank |
High school completion |
Education Rank |
NC HDI |
HDI Rank |
|
ALAMANCE |
$19,391 |
23 |
5.1 |
50 |
76.50 |
34 |
0.38 |
31 |
|
ALEXANDER |
$18,507 |
35 |
2.3 |
93 |
68.70 |
78 |
0.23 |
68 |
|
ALLEGHANY |
$17,691 |
46 |
9.4 |
7 |
68.00 |
85 |
0.29 |
53 |
|
ANSON |
$14,853 |
84 |
5.5 |
40 |
70.20 |
68 |
0.20 |
80 |
|
ASHE |
$16,429 |
64 |
5.5 |
40 |
68.60 |
79 |
0.22 |
72 |
|
AVERY |
$15,176 |
79 |
14.4 |
4 |
70.60 |
64 |
0.33 |
44 |
|
BEAUFORT |
$16,722 |
61 |
7.2 |
19 |
75.00 |
40 |
0.33 |
42 |
|
BERTIE |
$14,096 |
95 |
3.4 |
83 |
63.80 |
99 |
0.08 |
100 |
|
BLADEN
|
$14,735 |
87 |
4.3 |
69 |
70.60 |
65 |
0.19 |
85 |
|
BRUNSWICK |
$19,857 |
21 |
4.5 |
66 |
78.30 |
24 |
0.41 |
26 |
|
BUNCOMBE |
$20,384 |
18 |
9.0 |
8 |
81.90 |
17 |
0.52 |
11 |
|
BURKE |
$17,397 |
50 |
6.5 |
27 |
67.60 |
86 |
0.24 |
62 |
|
CABARRUS |
$21,121 |
15 |
7.0 |
21 |
78.20 |
25 |
0.47 |
17 |
|
CALDWELL |
$17,353 |
53 |
5.3 |
45 |
66.20 |
90 |
0.21 |
77 |
|
CAMDEN
|
$18,681 |
31 |
0.0 |
100 |
82.10 |
13 |
0.37 |
35 |
|
CARTERET |
$21,260 |
13 |
5.0 |
54 |
82.10 |
14 |
0.50 |
13 |
|
CASWELL |
$16,470 |
63 |
2.8 |
88 |
69.20 |
74 |
0.20 |
83 |
|
CATAWBA |
$20,358 |
19 |
6.5 |
27 |
74.80 |
43 |
0.40 |
27 |
|
CHATHAM |
$23,355 |
6 |
4.3 |
69 |
77.90 |
27 |
0.48 |
15 |
|
CHEROKEE |
$15,814 |
73 |
7.7 |
16 |
73.30 |
48 |
0.29 |
51 |
|
CHOWAN |
$15,027 |
81 |
7.8 |
15 |
73.10 |
50 |
0.27 |
58 |
|
CLAY |
$18,221 |
39 |
7.7 |
16 |
76.50 |
35 |
0.39 |
30 |
|
CLEVELAND |
$17,395 |
51 |
5.4 |
43 |
72.20 |
52 |
0.29 |
55 |
|
COLUMBUS |
$14,415 |
93 |
4.0 |
74 |
68.60 |
80 |
0.15 |
89 |
|
CRAVEN |
$18,423 |
36 |
5.6 |
37 |
82.10 |
15 |
0.44 |
21 |
|
CUMBERLAND |
$17,376 |
52 |
5.0 |
54 |
85.00 |
6 |
0.44 |
20 |
|
CURRITUCK |
$19,908 |
20 |
1.8 |
97 |
77.60 |
29 |
0.37 |
37 |
|
DARE |
$23,614 |
4 |
4.9 |
60 |
88.60 |
2 |
0.63 |
5 |
|
DAVIDSON |
$18,703 |
30 |
4.5 |
66 |
72.00 |
54 |
0.30 |
49 |
|
DAVIE |
$21,359 |
12 |
3.6 |
81 |
78.10 |
26 |
0.43 |
23 |
|
DUPLIN |
$14,499 |
90 |
4.6 |
63 |
65.80 |
92 |
0.13 |
91 |
|
DURHAM |
$23,156 |
8 |
20.9 |
2 |
83.00 |
9 |
0.75 |
1 |
|
EDGECOMBE |
$14,435 |
92 |
3.9 |
77 |
65.60 |
93 |
0.12 |
93 |
|
FORSYTH |
$23,023 |
10 |
10.6 |
5 |
82.00 |
16 |
0.60 |
7 |
|
FRANKLIN |
$17,562 |
48 |
2.6 |
90 |
73.60 |
45 |
0.27 |
57 |
|
GASTON |
$19,225 |
24 |
6.0 |
31 |
71.40 |
59 |
0.33 |
43 |
|
GATES |
$15,963 |
69 |
2.0 |
95 |
71.40 |
60 |
0.20 |
82 |
|
GRAHAM |
$14,237 |
94 |
6.6 |
26 |
68.40 |
82 |
0.18 |
87 |
|
GRANVILLE |
$17,118 |
56 |
6.0 |
31 |
73.00 |
51 |
0.30 |
50 |
|
GREENE |
$15,452 |
77 |
1.7 |
98 |
65.40 |
95 |
0.11 |
95 |
|
GUILFORD |
$23,340 |
7 |
7.1 |
20 |
83.00 |
10 |
0.58 |
8 |
|
HALIFAX |
$13,810 |
96 |
4.8 |
62 |
65.40 |
96 |
0.11 |
96 |
|
HARNETT |
$16,775 |
59 |
4.0 |
74 |
75.00 |
41 |
0.29 |
54 |
|
HAYWOOD |
$18,554 |
34 |
5.3 |
45 |
77.70 |
28 |
0.38 |
33 |
|
HENDERSON |
$21,110 |
16 |
6.8 |
24 |
83.20 |
8 |
0.53 |
10 |
|
HERTFORD |
$15,641 |
76 |
8.6 |
11 |
65.60 |
94 |
0.20 |
81 |
|
HOKE |
$13,635 |
97 |
3.2 |
86 |
73.50 |
46 |
0.19 |
86 |
|
HYDE |
$13,164 |
100 |
3.9 |
77 |
68.40 |
83 |
0.12 |
92 |
|
IREDELL |
$21,148 |
14 |
5.7 |
35 |
78.40 |
23 |
0.46 |
19 |
|
JACKSON |
$17,582 |
47 |
10.3 |
6 |
78.80 |
22 |
0.43 |
22 |
|
JOHNSTON |
$18,788 |
28 |
4.4 |
68 |
75.90 |
37 |
0.35 |
39 |
|
JONES |
$15,916 |
71 |
8.6 |
11 |
72.20 |
53 |
0.29 |
52 |
|
LEE |
$19,147 |
25 |
6.5 |
27 |
76.30 |
36 |
0.39 |
28 |
|
LENOIR |
$16,744 |
60 |
5.4 |
43 |
71.90 |
56 |
0.27 |
60 |
|
LINCOLN |
$18,877 |
26 |
5.1 |
50 |
71.70 |
58 |
0.31 |
48 |
|
MACON |
$16,109 |
67 |
5.2 |
48 |
70.20 |
69 |
0.23 |
69 |
|
MADISON |
$18,642 |
32 |
4.9 |
60 |
77.30 |
30 |
0.37 |
36 |
|
MARTIN |
$16,076 |
68 |
5.0 |
54 |
69.30 |
73 |
0.21 |
75 |
|
MCDOWELL |
$15,102 |
80 |
5.0 |
54 |
70.70 |
63 |
0.21 |
78 |
|
MECKLENBURG |
$27,352 |
1 |
8.9 |
9 |
86.20 |
5 |
0.74 |
2 |
|
MITCHELL |
$15,933 |
70 |
7.5 |
18 |
68.60 |
81 |
0.23 |
65 |
|
MONTGOMERY |
$16,504 |
62 |
1.2 |
99 |
64.20 |
98 |
0.11 |
94 |
|
MOORE |
$23,377 |
5 |
5.9 |
33 |
82.60 |
11 |
0.56 |
9 |
|
NASH |
$18,863 |
27 |
6.9 |
22 |
75.60 |
38 |
0.38 |
32 |
|
NEW HANOVER |
$23,123 |
9 |
8.8 |
10 |
86.30 |
4 |
0.64 |
4 |
|
NORTHAMPTON |
$15,413 |
78 |
2.4 |
92 |
62.50 |
100 |
0.08 |
99 |
|
ONSLOW |
$14,853 |
85 |
3.7 |
80 |
84.30 |
7 |
0.36 |
38 |
|
ORANGE |
$24,873 |
3 |
2.5 |
91 |
87.60 |
3 |
0.62 |
6 |
|
PAMLICO |
$18,005 |
42 |
8.6 |
11 |
75.20 |
39 |
0.38 |
34 |
|
PASQUOTANK |
$14,815 |
86 |
3.6 |
81 |
76.80 |
32 |
0.26 |
61 |
|
PENDER |
$17,882 |
43 |
1.9 |
96 |
76.80 |
33 |
0.31 |
47 |
|
PERQUIMANS |
$15,728 |
74 |
3.4 |
83 |
71.90 |
57 |
0.22 |
74 |
|
PERSON |
$18,709 |
29 |
15.2 |
3 |
74.90 |
42 |
0.47 |
16 |
|
PITT
|
$18,243 |
37 |
6.8 |
24 |
79.90 |
21 |
0.42 |
25 |
|
POLK |
$19,804 |
22 |
4.0 |
74 |
80.60 |
19 |
0.43 |
24 |
|
RANDOLPH |
$18,236 |
38 |
5.0 |
54 |
70.00 |
70 |
0.27 |
56 |
|
RICHMOND |
$14,485 |
91 |
4.3 |
69 |
69.20 |
75 |
0.17 |
88 |
|
ROBESON |
$13,224 |
99 |
5.5 |
40 |
64.90 |
97 |
0.10 |
98 |
|
ROCKINGHAM |
$17,120 |
55 |
5.0 |
54 |
68.90 |
77 |
0.23 |
63 |
|
ROWAN |
$18,071 |
41 |
5.6 |
37 |
74.20 |
44 |
0.33 |
41 |
|
RUTHERFORD |
$16,270 |
66 |
4.3 |
69 |
70.40 |
67 |
0.22 |
71 |
|
SAMPSON |
$14,976 |
83 |
5.7 |
35 |
69.10 |
76 |
0.19 |
84 |
|
SCOTLAND |
$15,693 |
75 |
5.1 |
50 |
71.40 |
61 |
0.23 |
66 |
|
STANLY |
$17,825 |
44 |
2.1 |
94 |
73.40 |
47 |
0.27 |
59 |
|
STOKES |
$18,130 |
40 |
5.6 |
37 |
73.20 |
49 |
0.32 |
46 |
|
SURRY |
$17,722 |
45 |
5.1 |
50 |
67.00 |
88 |
0.23 |
70 |
|
SWAIN |
$14,647 |
89 |
5.8 |
34 |
70.50 |
66 |
0.21 |
79 |
|
TRANSYLVANIA |
$20,767 |
17 |
2.7 |
89 |
82.50 |
12 |
0.46 |
18 |
|
TYRRELL |
$13,326 |
98 |
3.9 |
77 |
66.30 |
89 |
0.10 |
97 |
|
UNION |
$21,978 |
11 |
5.2 |
48 |
80.20 |
20 |
0.49 |
14 |
|
VANCE |
$15,897 |
72 |
8.1 |
14 |
68.10 |
84 |
0.23 |
64 |
|
WAKE |
$27,004 |
2 |
3.3 |
85 |
89.30 |
1 |
0.70 |
3 |
|
WARREN |
$14,716 |
88 |
3.0 |
87 |
67.50 |
87 |
0.14 |
90 |
|
WASHINGTON |
$14,994 |
82 |
6.9 |
22 |
69.90 |
71 |
0.22 |
73 |
|
WATAUGA |
$17,258 |
54 |
4.6 |
63 |
81.60 |
18 |
0.39 |
29 |
|
WAYNE |
$17,010 |
58 |
4.6 |
63 |
77.20 |
31 |
0.33 |
40 |
|
WILKES |
$17,516 |
49 |
5.3 |
45 |
66.00 |
91 |
0.21 |
76 |
|
WILSON |
$17,102 |
57 |
4.3 |
69 |
69.40 |
72 |
0.23 |
67 |
|
YADKIN |
$18,576 |
33 |
6.2 |
30 |
72.00 |
55 |
0.32 |
45 |
|
YANCEY |
$16,335 |
65 |
27.1 |
1 |
71.10 |
62 |
0.51 |
12 |
In terms of worst performing, Bertie County is last in overall human development, ranking ninety-fifth in income ($14,096.00), eighty-third in health, and ninety-ninth in education. Hyde County ranks last in income ($13,164.00), seventy-seventh in health, and eighty-third in education, ranking ninety-second in overall human development. Camden County ranks last in health, but thirty-first in income, thirteenth in education, and ranks thirty-fifth overall. Northampton County ranks last in education, ranking seventy-eighth in income ($15,413.00), ninety-second in health, and ninety-ninth overall. HDIs allow broader assessments of the vulnerability of a county to external crises (Benzing 1999, 2000). It is particularly favorable that a given county is not last in all three categories, which would suggest high vulnerability.
Figure 1 shows the geographic distribution of the most deprived counties, which are primarily rural. There are clear pockets of NCI deprivation, which tend to cluster away from the state's urban areas, but the distribution of these pockets is fairly even across the state.
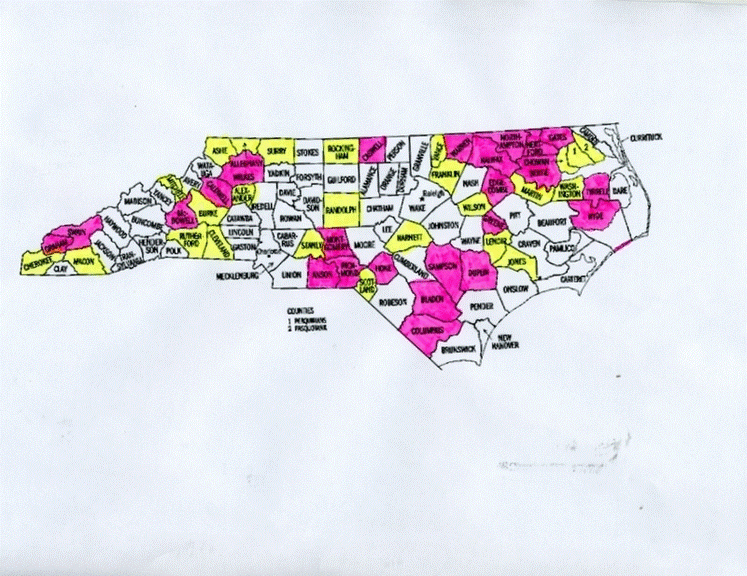
Figure 1
Geographic Distribution of NCHDI Deprived Counties
Fourth quartile counties
(most deprived/poorest performing) indicated in pink. Third quartile counties (next most
deprived/poorest performing) indicated in yellow. White counties in the first and second
quartiles have average or above average attainment according to NCHDIs.
Discussion
HDIs alone indicate how well a county is doing relative to other counties, but give no indication of human development performance on an absolute scale. No matter how well off a state is, half of its counties will always be below average. One will always rank first and one will always rank last, overall as well as in each category.
The overall HDI for Durham County is 75 percent, and for Bertie County is 8 percent. This is a staggering difference, reflecting average deprivation ratios of 25 percent and 92 percent, respectively. This quantifies the difference between a wealthy urban county and a poor rural county, and suggests the need for policy measures.
In terms of per capita income, Mecklenburg's ($27,352.00) is more than twice Hyde's ($13,164.00). In terms of physicians per 10,000 population, Yancy County has nearly thirty, and Hoke has virtually zero. High school completion rates are far less dispersed in that Wake's (89% of the population 25 or older) is approximately 1.4 times Northampton's (62%). This observation suggests high school completion performs well as a proxy for literacy. In terms of literacy in 1996, Orange County's composite literacy index, 293, is about forty percent higher than Northampton County's 222 (Siedow 1998).
If the UNDP's national level measures of income, health, and education were used, and if deprivation ratios were calculated based on the Human Development Report's maximum and minimum values for each human development dimension, then county level HDIs could be compared directly to national HDIs. If the North Carolina county with the lowest HDI were roughly comparable to Spain that would indicate an outstanding state of affairs. If the lowest county level HDI were equal to Bangladesh's, it would indicate an urgent policy crisis. Unfortunately, because the county level HDIs are based on different kinds of data, direct comparison with national HDIs is impossible. Nevertheless, useful policy information is provided by the HDIs, if not necessarily by comparing the rankings internationally.
Conclusion
Human development indices are useful for analyzing disparities and assessing needs among different counties in a state, but the overall methodology is more widely applicable to other geographic units. In addition, different measures of the human development dimensions can be used, either to address different areas of concern, or to make use of different data.
The NCHDIs suggest where development spending should be a priority, namely in the counties with the lowest HDIs, loosely defined as those below the average, or ranked above 50. More specifically, they also indicate broadly what mode that spending should take in order to have the greatest impact. Initiatives aimed at industrial development, employment enhancement, or income redistribution, should be targeted especially at counties with the lowest income rankings. Health initiatives should be targeted at counties with the lowest health rankings, and education initiatives should target counties with the lowest education rankings. Human development can be improved by augmented spending on income redistribution, education, and health care, but also by the residential migration economic development encourages with enhanced employment opportunity. It is important to realize that migration can amplify the effectiveness of development policy, but also undo and frustrate otherwise well-considered policy measures. Policy initiatives must recognize that augmented spending may result in the most desirable and productive workers migrating out of the deprived counties to those with more attractive economic opportunities.
Acknowledgments
Thanks are due to Chris Cooper for helpful comments and suggestions, to Megan Hazelrig for assistance with the North Carolina map, and to Cynthia Benzing and Bienvenido Cortes for first interesting me in human development indices by demonstrating their potential uses. I remain responsible for all errors, omissions, or shortcomings.
Bionote
Robert F. Mulligan is associate professor of economics in the Department of Business Computer Information Systems and Economics at Western Carolina University, Cullowhee NC 28723, USA. He is also a visiting research fellow of the American Institute for Economic Research in Great Barrington, Massachusetts, and a senior research fellow of the Center for Maritime Studies at the United States Merchant Marine Academy in Kings Point, New York. His research interests include business cycle theory, constitutional political economy, and maritime economics. His articles have been published in the Quarterly Journal of Austrian Economics, the Review of Austrian Economics, Constitutional Political Economy, Education and Culture: the Journal of the John Dewey Society, the Journal of Private Enterprise, the Quarterly Review of Economics and Finance, International Advances in Economic Research, the Atlantic Economic Journal, and Applied Economics Letters.
References
Benzing, Cynthia Dell. 1999. Using Discriminant Analysis to Predict Financial Distress in Emerging Countries. Economics and Finance Department, West Chester University.
Benzing, Cynthia Dell. 2000. Using Discriminant Analysis to Predict Financial Distress. Research Note. International Advances in Economic Research 6(3): 591.
Conover, Chris. 1998. Highlights from State Reports: Health Policy for Low-Income People in North Carolina. Washington: The Urban Institute (12-98) <<http://newfederalism.urban.org/html/Highlights/NCHealth.html>> (5-30-00).
Cortes, Bienvenido S. 1999. Regional Economic Performance in the Philippines: Alternative Measures and Determinants. Department of Economics, Finance & Banking, Pittsburgh State University, Pittsburgh, Kansas.
Kaminarides, John and Edward Nissan. 1999. A Comparative Economic Development Analysis Using a Human Development Index. Department of Economics and Decision Sciences, Arkansas State University College of Business; Department of Economics, University of Southern Mississippi School of Business Administration.
Siedow, Mary Dunn. 1998. Literacy in North Carolina. Raleigh: North Carolina Literacy Resource Center <<http://www.nclrc.state.nc/home/reports/litnc98.htm>> (3-24-00).
North Carolina Department of Health and Human Services (NCDHHS). 1997. North Carolina Vital Statistics. Raleigh: Division of Epidemiology, State Center for Health Statistics.
United Nations Development Programme (UNDP). 1990-. Human Development Report. New York: Oxford University Press.
U.S. Census
Bureau. 2006. County-level data from the 2000 census. http://factfinder.census.gov/
(2-18).