A Forecast of North Carolina Unemployment Rates For 2001-2002 Using Past Inflation


RENEE LEWIS and CYNTHIA BROWN
College of Business
Western Carolina University


Abstract

This paper forecasts unemployment rates for North Carolina for the years 2001 and 2002 using past consumer price index data.The Phillips Curve is used in this paper because of the inverse relationship between inflation and unemployment rates.Unemployment rates and the consumer price indices for the years 1991-2000 were used to forecast 2001 and 2002 unemployment rates for North Carolina.The unemployment rate for North Carolina is forecast to rise to 3.18% and then fall to 2.66%.The Phillips Curve is an appropriate measure for unemployment rates based on inflation in this case because it represents the inverse relationship between inflation and unemployment rates. (JEL:E24)

Part 1. Introduction

This paper forecasts the unemployment rate for North Carolina for the years 2001 and 2002.The forecast is estimated using consumer price indices from the years 1991 until 2000.This data is monthly and not seasonally adjusted.
Using the Phillips Curve, the inverse relationship between inflation and unemployment is apparent.Whenever unemployment is high, inflation tends to be low. When unemployment is low, inflation tends to be high.Forecasting unemployment accurately is important because it helps economists to have a better idea of what the future economy holds.Another important reason for accurate forecasts is the fact that many job seekers are interested in this data before making a final decision about a job.
The rest of this paper is as follows: Part 2. presents CPI and past unemployment rates data and where it was taken from; Part 3. presents the economic theory behind this forecast; Part 4. presents the actual forecast of unemployment rates for 2001 and 2002; Part 5. outlines forecast implications; and Part 6. is where all conclusions are drawn.

Part 2. Data

All data was taken from the Bureau of Labor Statistics web site.Unemployment rates for North Carolina are given in BLS variable LAUST37000003.The consumer price index variable is CUUR0300SA0.The unemployment rate and consumer price index is calculated on a monthly basis on the BLS site, but were not seasonally adjusted.The forecast horizon is two future years, 2001 and 2002.
The forecast unemployment rate is based on past consumer price index data from the years 1991-2000.None of the data was altered or transformed in any way. Since monthly figures were used, the forecast data shows the estimates for all twelve months of the year as well.
The Phillips Curve is a graphic representation of the economic relationship between unemployment and inflation.A.W. Phillips found there is an inverse relationship between the two.As prices and wages go up, the unemployment rate tends to go down.This is intuitively appealing because more are out to get jobs when inflation increases due to price/wage changes.Whenever an employer raises wages, more people may come to work, lowering the unemployment rate.


Part 3.  Economic Theory: Predicting North Carolina Unemployment with the Phillips Curve


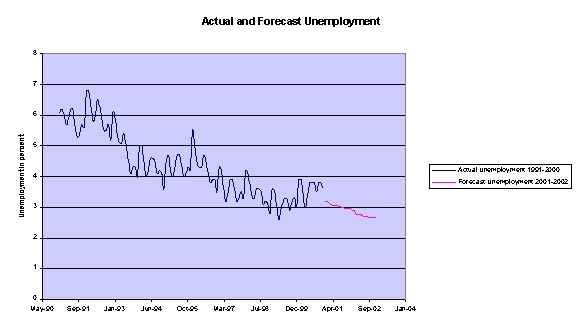
The forecast only goes into the future two years.Since the Phillips Curve deals with short-run data.

Unemployment rate is a function of consumer price index: 

u = f (p)

The Phillips Curve shows this equation graphically.Due to unemployment being a function of consumer price index, the equation CPI variable is lagged for the current year. This lagged equation was used in forecasting the rates for 2001 and 2002.In part four, it is discussed how the numbers plugged into the equation were calculated.

 Part 4.  Empirical Results

A Short-term Forecast Of North Carolina’s Unemployment Rates for 2001-2002

The equation used for forecasting was estimated through the least squared regression method, utilizing observations gathered from 1991-2000.The r-squares estimate is .6123.The f-statistic is 2.86208E-21.There was a probability of 9.08E-32 of committing a Type I error for the intercept parameter.A probability of 2.86E21 of committing a Type I error occurred in the estimation of the lagged consumer price index.
The numbers 12.89 and .06 were calculated by using the least squares regression.These numbers plugged into the unemployment equation gave the forecasted rates for 2001 and 2002.


Table 1

Regression Statistics
Intercept:
12.89
t-stat
17.75
P-value 
9.08 E-32
CPI (-2)
-.0607
t-stat
-12.29
P-value
2.86 E-21
R Square
.6164


Table 2

Actual Forecast for 2001 and 2002

Month/ Year

Forecast

January 2001
3.18
February 2001
3.17
March 2001
3.13
April 2001
3.08
May 2001
3.07
June 2001
3.07
July 2001
3.04
August 2001
3.01
September 2001
2.98
October 2001
2.95
November 2001
2.96
December 2001
2.95
January 2002
2.92
February 2002
2.88
March 2002 
2.78
April 2002
2.76
May 2002
2.76
June 2002
2.72
July 2002
2.69
August 2002
2.69
September 2002
2.65
October 2002
2.65
November 2002
2.65
December 2002
2.66


Part 5. The Future Looks Better in 2002 for North Carolina Residents

As it turns out, unemployment will rise in 2001and than decrease by 2002.This forecast was important in order to measure the condition of the economy in 2001 and 2002.It is important to the residents of North Carolina to see what the relationship between unemployment and inflation holds for the future.Based on the data, unemployment will be lower in 2002 than it has been in the past ten years.This forecast turned out to be favorable for the employees and residents of North Carolina.Assuming the natural rate of unemployment is 5%and this forecast has accurate estimates, North Carolina rates are considerably lower than the natural rate.

 
Part 6. Policy Conclusions

North Carolina’s unemployment rates are projected to rise 3.18% in 2001 and then fall to 2.66 % in 2002.This will be one of the lowest rates North Carolina has seen in over ten years, and will be good for the economy and the working class.The North Carolina rate compared to the assumed natural rate of 5% is good.To keep unemployment rates low the government should continue implementing current monetary policies because they obviously working for North Carolina.

References

Bureau of Labor Statistics, http://146.142.4.24/cgibin/surveymost/accessed February 2001


The Phillips Curve, http://econ161.berkley.edu/multimedia/Pcurve1.htmlaccessed February 2001


Phillips Curve, http://www.britannica.com/seo/p/phillips-curve/accessed February 2001