
The Relationship between the Inflation Rate and the
Unemployment Rate: Year 2001 and 2002 Outlook
DUSTIN ALSOP and CHRIS BURNS
College of Business
Western Carolina University
Abstract
DUSTIN ALSOP and CHRIS BURNS
College of Business
Western Carolina University
Abstract
The U.S. inflation rate is forecast to decrease steadily month by month in 2001 and 2002. This forecast is based on the New Classical School interpretation of the Phillips curve. The U.S. unemployment rate is the explanatory variable. U.S. monthly unemployment rates and inflation rates from January 1992 through December 2000 were used to forecast inflation. This forecast suggests that as the inflation rate steadily decreases over 2001 and 2002, the unemployment rate will steadily increase over 2001 and 2002. The average annual inflation forecast for 2001 is 2.31%, and the average annual inflation forecast for 2002 is 0.88%. (JEL: E130).
Part 1. Introduction
This paper forecasts U.S. inflation rates for the years 2001 and 2002. The explanatory variable is the U.S. unemployment rate. The approach is based on the New Classical School using the Phillips curve. The Phillips curve asserts the short-run relationship between inflation and employment. The government can use the forecast of future inflation to predict future unemployment rates. This can be done assuming work expectations do not change. The short-run Phillips curve will intersect the natural rate of unemployment at the expected inflation rate until workers respond by changing their expectations. The natural rate of unemployment is approximately 5.5% (Thomas 1997, p.442).
Inflation will increase as the unemployment rate falls below the natural rate. The government can use the short-run trade-off between inflation and unemployment by raising prices faster than workers expect, which will raise employment. However, if the government were to do this, it is critical that the forecast of inflation is as accurate as possible.
The rest of this paper is organized as follows: part 2. presents the data used to forecast inflation rates; part 3. explains the theoretical basis for the approach adopted in forecasting inflation rates; part 4. presents the forecasts of inflation rates for years 2001 and 2002; part 5. evaluates the importance of the forecasts for the economy; and part 6. discusses conclusions for economic policy.
Part 2. Data
The inflation variable and unemployment variable are taken from the Federal Reserve Bank of St. Louis Federal Reserve Economic Data (FRED). The inflation rates are taken from the Consumer Price Index (CPI) For All Urban Consumers. The measure of inflation is FRED variable CPIAUCSL, seasonally adjusted. The primary source is the U.S. Department of Labor, Bureau of Labor Statistics. The measure of the unemployment rate is FRED variable UNRATE, seasonally adjusted. The primary source is also the U.S. Department of Labor, Bureau of Labor Statistics. The inflation variable and the unemployment variable are observed monthly. The sample period for the data used is from January 1992 through December 2000. The forecast horizon is limited to two years in an attempt to have a more accurate prediction for inflation over 2001 and 2002.
The unemployment rate and the inflation rate are the two necessary parts
of the Phillips curve and therefore, both had to be used to compute a forecast.
The inflation and unemployment trade-off is shown with an upward slope
in the short-run Phillips curve. The inflation rates and the unemployment
rates were used because both can easily be found on the Internet through
FRED and the information can be accessed by anyone.
Part 3. The New Classical Phillips Curve as a Forecasting Instrument
This forecast assumes the natural rate unemployment rate to be approximately 5.5% (Thomas 1997, p.442). There is a relationship between inflation and unemployment that the short-run Phillips curve shows. The Phillips curve is upward sloping in the short-run, which reflects a relationship between inflation and unemployment. The short-run Phillips curve will intersect the long-run Phillips curve at the inflation rate people expect to see in the future. A forecast of inflation is one of three methods that economists can use to estimate expected inflation. The other two methods used to estimate expected inflation are measures based only on recent inflation and results from surveys of expected inflation such as the Michigan Survey and the Livingston Survey. The unemployment rate is a function of the inflation rate and can be written as:
u = f(i),
where u is the unemployment rate and i is the inflation rate. Using a linear regression model and solving for the inflation rate, the equation is written as:
it = a + but
The above equation shows two constants, a and b. These are used to determine the linear regression. The a represents the intercept coefficient and the b represents the unemployment coefficient.
it = a + but-24
This equation shows the unemployment rate lagged by twenty-four months or two years. This is the equation used to calculate the inflation forecast in Part 4.
Part 4. Empirical Results
The unemployment rate was lagged twenty-four months to forecast inflation. The regression estimate is (t-statistics in parenthesis):
it = -1.123143(-8.876652) + 0.435785(6.461423)u t-24
The adjusted R-square of the estimate is .481, which indicates that
approximately 48% of the variation of inflation is explained by the variation
in the unemployment rate from twenty-four months earlier. The t-statistic
is significant because the P-value of each coefficient is approximately
zero. The F-statistic is 39.4, which indicates a rejection of the
null hypothesis of zero slopes. The significance of the F-statistic
is approximately zero.
|
|
|
|
|
|
|
|
|
|
|
|
|
|
|
|
|
|
|
|
|
|
|
|
|
|
|
|
|
|
|
|
|
|
|
|
|
|
|
|
|
|
|
|
|
|
|
|
|
|
|
|
|
|
|
|
|
|
|
|
|
|
|
|
|
This forecast projects inflation will steadily decrease throughout 2001 and 2002. This forecast predicts a decrease of approximately 1% in annual inflation from the year 2000 to 2001, and a decrease of approximately 1.5% in annual inflation from the year 2001 to 2002.
Chart 1
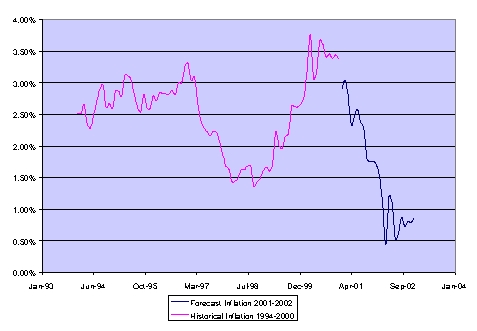
This chart reflects historical U.S. inflation from January 1994 through December 2000. This chart also shows the forecast of lower U.S. inflation for 2001 and 2002.
Part 5. A Rosy Outlook
Inflation forecasts are mostly interesting to the Chairman of the Board of Governors (currently Alan Greenspan). The Chairman of the Board of Governors sets the level of interest rates that can ultimately influence the inflation rates. Inflation expectations can powerfully influence the level of interest rates. Alan Greenspan can use the forecast of inflation to either raise the interest rate or lower the interest rate. Interest rates will typically be lowered when inflation is expected to decline, and interest rates will typically be increased when inflation is expected to rise. If Alan Greenspan were to use this forecast of inflation, then he would steadily lower interest rates over the next two years.
Inflation forecasts are also interesting to the working population. Lower inflation forecasts are favorable to the working population in the sense that they will expect prices to remain steady. The working population can also view lower inflation forecasts as an unfavorable situation because they will expect lower wage increases while inflation is low. A low inflation forecast for the next two years suggests that the time to make a major purchase such as a car or a home should be done within the next two years while prices are forecast to be low. There will be fewer job vacancies during times of low inflation and low unemployment.
Part 6. Policy Conclusions
In 2001, U.S. inflation is forecast to peak at 3.03% but by the end of the year U.S. inflation is forecast to decrease to 1.70%. In 2002, U.S. inflation is projected to reach a high of 1.52% but from June through December, U.S. inflation is projected to remain less than 1%.
Assuming the forecast turns out to be correct, industries such as construction, financial services, retail, and auto manufacturers will do well in times of lower inflation. The construction industry will benefit from lower inflation because people will be making home purchases while prices will remain low. The auto manufacturers industry will also benefit for the same reason. People are more likely to buy new cars when the prices are expected to be low. The financial services industry will benefit because during low inflation people will increase their money supply and have more money to invest. The retail industry will benefit because people will have more money to spend on goods and services during low inflation.
The government can raise the price level faster than the working population expects and in turn the government will lower unemployment. If this is done, then wages will not increase as fast as the price of output and therefore, more workers will need to be hired. The Federal Reserve plays a major role in fluctuations in the money supply. The Federal Reserve should use a tight money policy over the next two years.
References
Federal Reserve Bank of St. Louis, Federal Reserve Economic Data (FRED) (12-31-00), http://www.stls.frb.org/fred/ (2-12-01).
Thomas, Lloyd B., Money, Banking, and Financial Markets, New
York: McGraw-Hill, 1997.