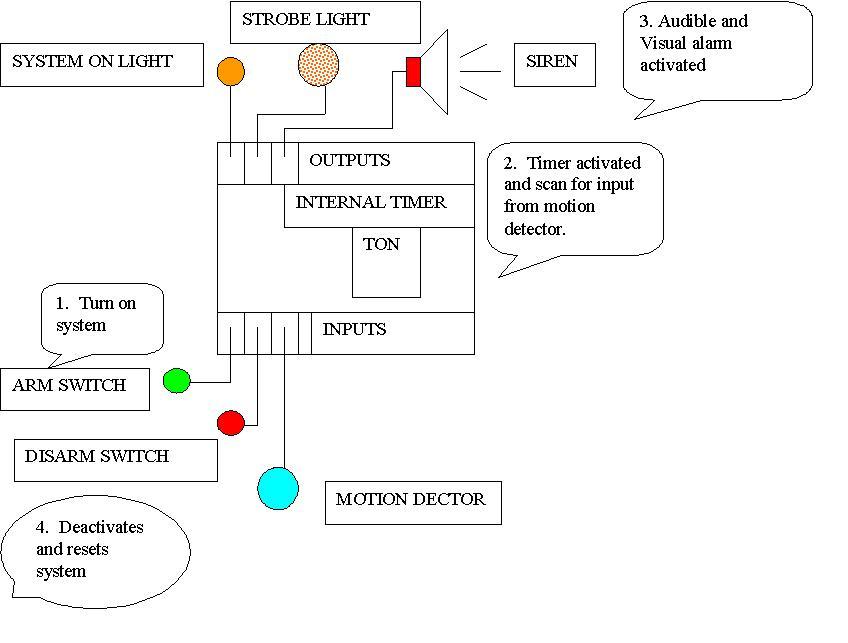
Figure 1: System Layout for an Alarm System with PLC Control.
ET 472 LABORATORY GUIDE
SECTION
POINTS
ABSTRACT
15
SYSTEM
DIAGRAM
10
TERMS AND
DEFINITIONS
10
REQUIRED SYSTEM
OPERATION
5
PROCEDURE
5
SYMBOL
CHART
10
SEQUENCE CONTROL
CHART
15
EXPLANATION OF
OPERATION
30
(INCLUDING WIRING DIAGRAM
AND CONTROL PROGRAM)
TOTAL 100
Follow the format as specified in the syllabus. Provide headers
and write clearly and concisely in 3rd person, past tense.
ABSTRACT:
The abstract is a summary stating what was done, when it was done, where it was done, how it was done, and the outcome. Example for laboratory 1.
What: Develop a control program for a
basic alarm system.
When: Jan. 11th 2012
Where: Engineering Technology Automation Laboratory
Belk 171
How: Graphical programming method
of ladder logic was completed
Using Siemens MicroWin Software. The program was simulated
on a Siemens S7-224 PLC and monitored in MicroWin. Upon
verification of program simulation, the program was downloaded to
a pre-configured PLC and alarm lab station.
Outcomes: The system was started by
a push button switch and armed after
an on-delay timer expired. A motion detector was used to sense movement
and activate both visual and audible alarms. The execution of the
system
was successful and verified program logic.
Therefore the abstract should be stated as follows:
The purpose of laboratory exercise one was
to develop a control program for a basic alarm system. Activities
were carried out on January 13, 2012 in the Engineering Technology automation
laboratory in Belk 171. The graphical method of PLC programming in
ladder logic was created in the MicroWin software package and transferred
to a Siemens S7-224 programmable controller for simulation. Upon
verification, the program was downloaded to a working laboratory station
and executed.
The system was armed and tested. After a time delay of 5 seconds,
when movement was detected by a motion detector, both visual and audible
alarms were activated. Alarms continued until the system was
deactivated and reset by a disarm switch. Execution of the system
was successful in meeting the objectives and verifying the program logic.
SYSTEM DIAGRAM:
A system diagram depicts what the system does and is NOT the control diagram. A graphical diagram must be provided to show the system layout and general function.
EXAMPLE:
Figure 1: System Layout for an Alarm System with
PLC Control.
TERMS AND DEFINITIONS:
Define terms relative to the current lab
.
Examples:
Motion Detector - Real world normally closed device. In this system it is an INPUT used to sense motion for activating output alarm after systems has been armed.
Arm Switch - Logical input number one; Normally Open (real world) manual push button switch for activating the alarm system in “stand-by” mode.
REQUIRED SYSTEM OPERATION:
Describe what the system should do in general terms. This description assumes “before the fact”; therefore, no addresses or specific outcomes should be addressed.
PROCEDURES:
Write in complete sentences and at least provide an introductory sentence before listing the steps required for carrying out the laboratory exercise. The procedures are the STEPS taken in carrying out the lab (not the steps of system operation).
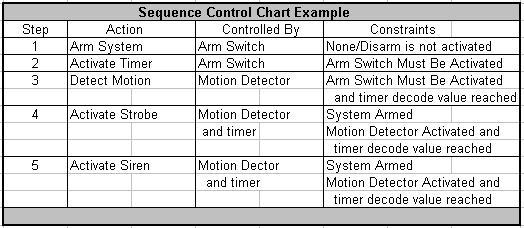
SEQUENCE CONTROL CHART (SQC)
The SQC provides a logical listing of sequential steps for program control
and all constraints that must be met for execution.
Example:
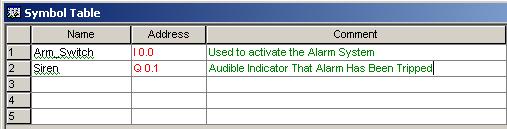
SYMBOLS CHART
The symbol chart should provide a logical name, address and description
of each input output, or internal function used in the program. An example
is
shown below:
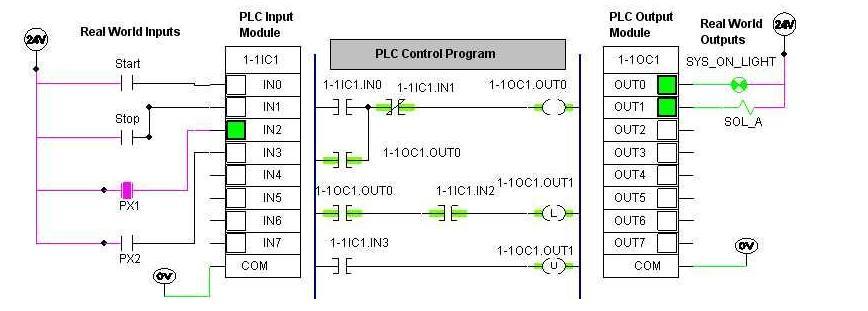
EXAMPLE WIRING DIAGRAM
(Refer to the example covered in class).
EXPLANATION OF SYSTEM OPERATION
This is the most important section of the report and worth the greatest
number of points.
Each step described should be done NETWORK BY NETWORK in the
program AND should reference each logical input, output and internal function
by name AND ADDRESS. This section demonstrates your knowledge
and understanding of how the system works and the program logic.
Example.
The following describes the logical operation of the system and control
for NETWORK 1.
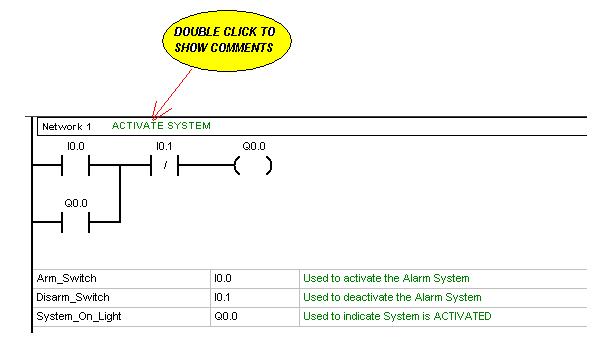
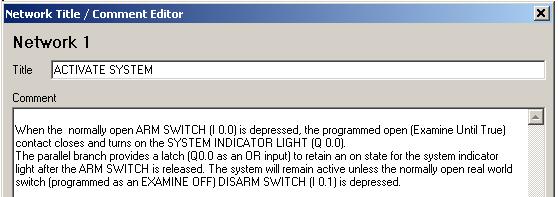
After Double clicking on the Network Title Block, the following window
will appear and comments
can be typed in as shown in the example below. After comments
have been typed in the MicroWin
program, you may cut and past into your lab report for each network.
APPENDICES
Accompanying documentation should be placed as appendices, and each appendix labeled. Items that normally should be included would be program listing, cross reference chart, wiring diagrams, and original laboratory sheets.
REFERENCES
References should be provided to show sources of information and procedures.