Relative Humidity RUNNING AVERAGE Lab
INTRODUCTION
In this exercise, you will create a VI that will monitor current Relative Humidity (R.H.) along with the average R.H. on a waveform chart. It will employ a while loop and shift register to do this. Elements added to the shift register will store R.H. data from previous iterations, and be used to calculate the average R.H.
Create a New VI (or use the VI from your previous lab)
Add a while loop to the Block Diagram
Wire a Boolean Stop Control and a Boolean NOT function to the conditional
terminal
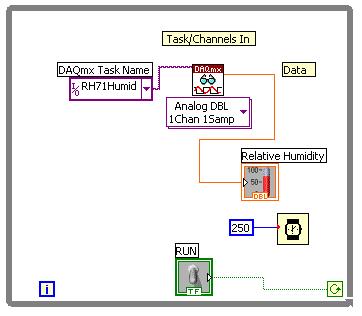
Add two Digital R.H. Acquisition Sub VIs; one inside the loop and one
outside
o The Digital R.H. Sub VI that is outside the loop is only read once at
the beginning of the first iteration and is
only used to initialize the register to read the initial room humidity.
o The R.H. Sub-VI must be created before this lab can be completed
You will add the following Sub-VI, and replace the random number simulated
temperature Sub-VI used in the
previous lab.
Note: You will receive error
messages if you do not create the exact tasks. The
section below describes how to create
the required tasks.
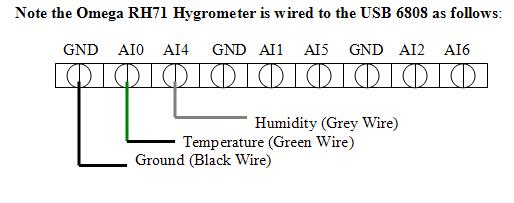
In order to acquire external data, a Data Acquisition (DAQ) device must be wired and connected to the computer running LabView. We will be using the NI-USB- 6808 DAQ unit. The follow steps are required to configure the device to read external humidity readings from an Omega RH71 hygrometer.
Make sure the NI-USB 6808 unit
is plugged into the USB port on your computer, and a blinking link light
is established before continuing. Note: if a link light is not present,
the driver must be installed from the CD that came with the device.
1. Open the Measurement and
Automation (MAX) software.
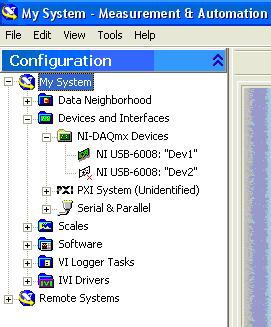
2. Click on Devices and Interfaces
and expand the selections.
3. The NI USB-6808 should be
shown as an available device.
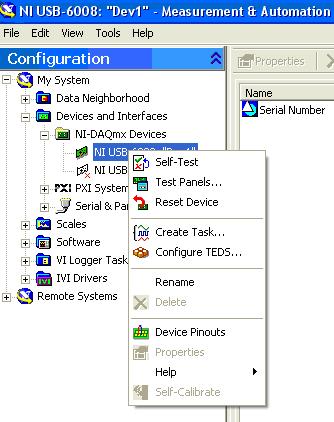
4. Right click on the NI-USB-6808
device icon and select CREATE TASK.
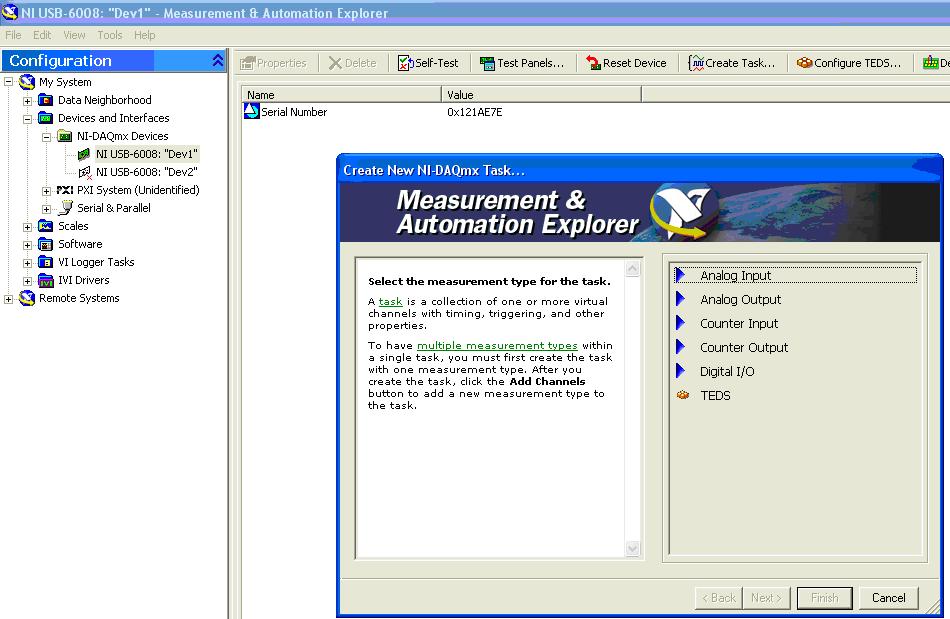
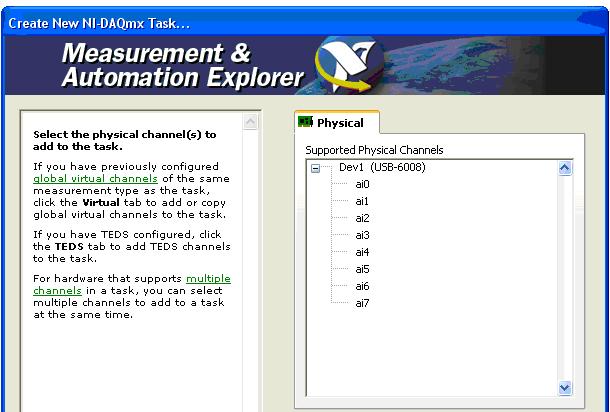
5. The following screen should appear: Select ANALOG INPUT.
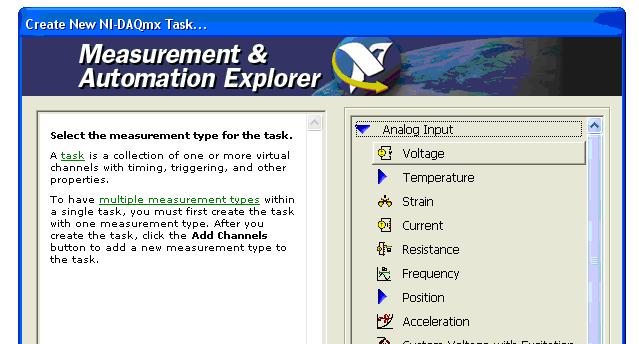
6. The following screen should appear: Select VOLTAGE.
7. The following screen should appear: Select AI4 (analog
input number 4):
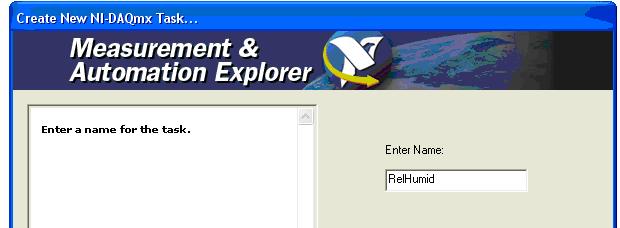
8. Enter the NAME of the TASK as shown below in the example:
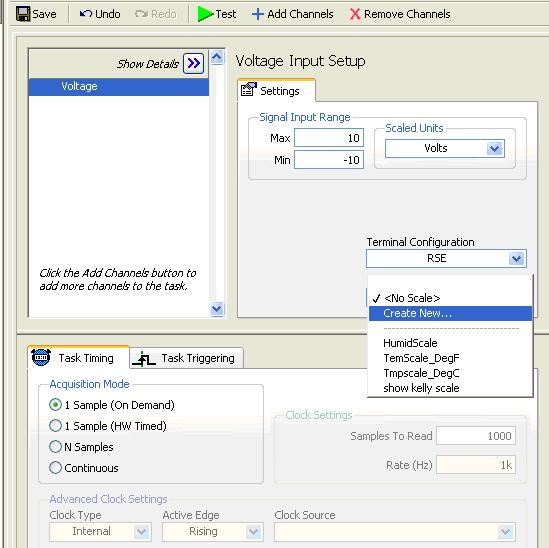
9. The VOLTAGE INPUT SETUP screen will appear.
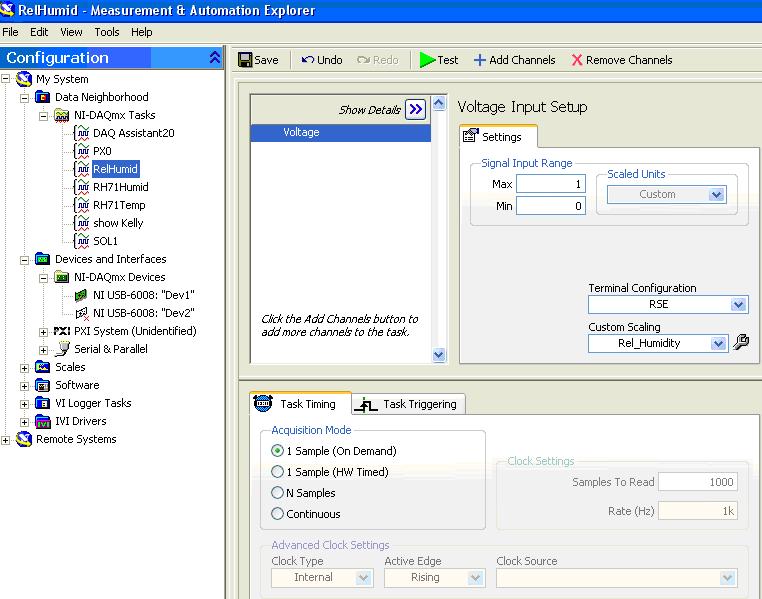
In the terminal configuration, select RSE (Reference Single End).
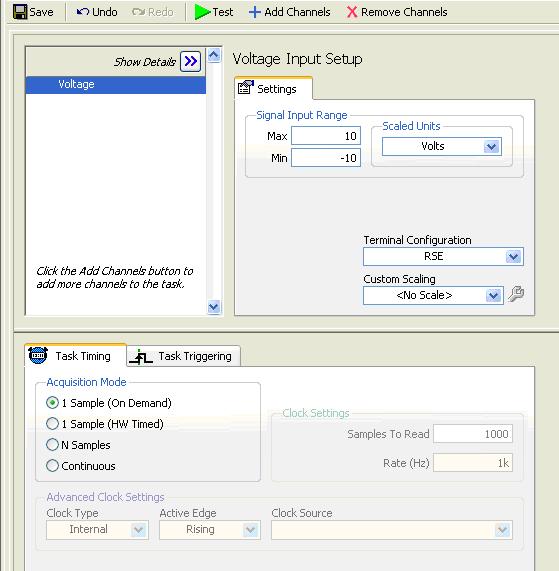
Next, a scale must be created to correspond to the desired representation
of acquired data.
The analog input voltage varies from 0 to +1; therefore, the desired
scale factor will be 100.
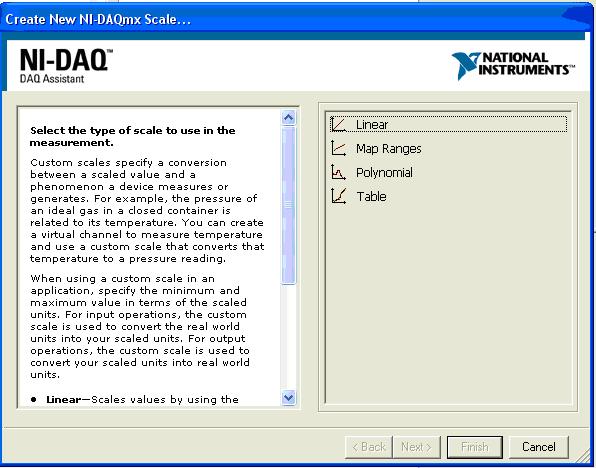
10. Click on SCALE, and then CREATE NEW as shown below
11. Next click on LINEAR as shown below:
12. Enter 100 for the slope of the linear scale. Note the Y intercept is at 0.
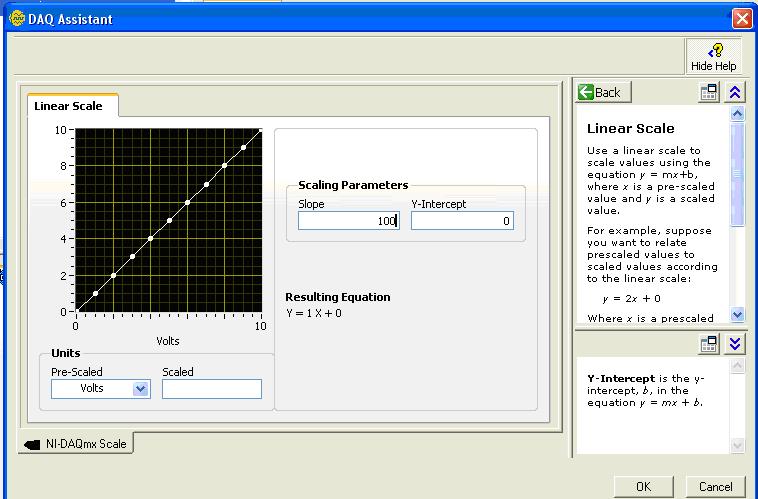
13. Click ok then enter the VOLTAGES LEVELS AS SHOWN
Note: MAX = 1, MIN = 0 and make sure the newly
created CUSTOM SCALE is set to the named scale you just created.
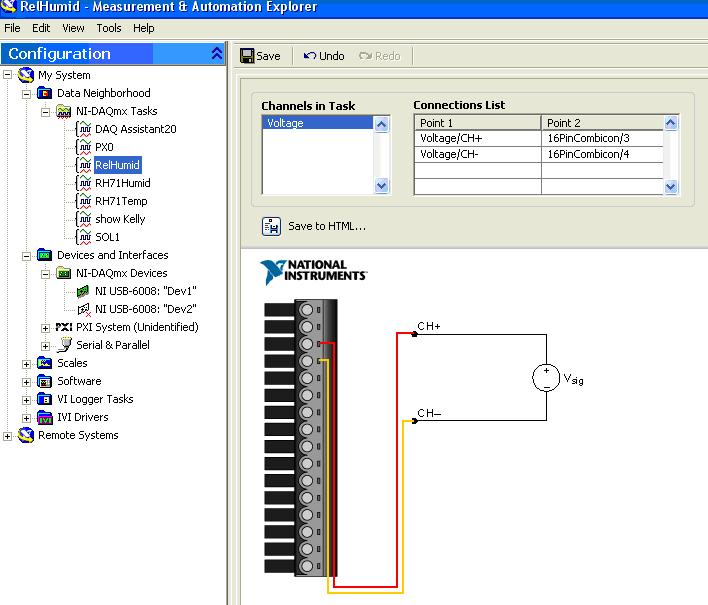
14. On the bottom tab, click on CONNECTION DIAGRAM to verify connections
as shown:
15. Close the connection diagram and then click on TEST (green arrow at top)
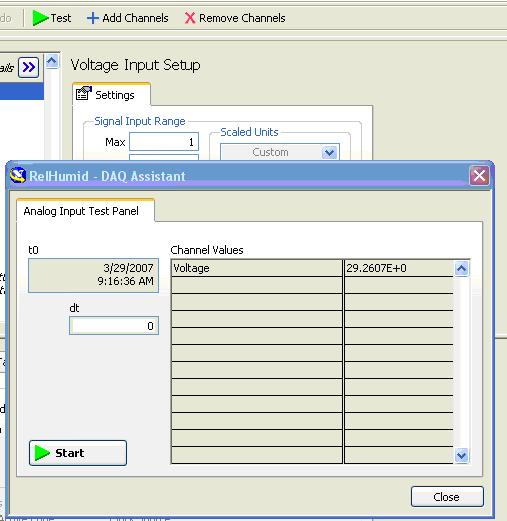
You should be reading a voltage corresponding to the HUMIDITY READING
shown on the screen of the Omega RH71 Hygrometer device.
1. Create the VI shown below.
2. Next add terminals to make the R.H. Sub-VI capable of being wired
to the main VI.
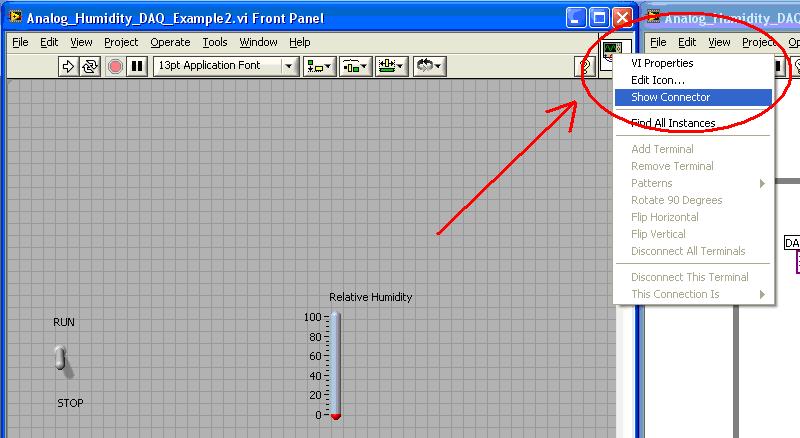
3. On the FRONT PANEL, right click on the ICON in the upper right
hand corner, and select SHOW CONNECTOR.
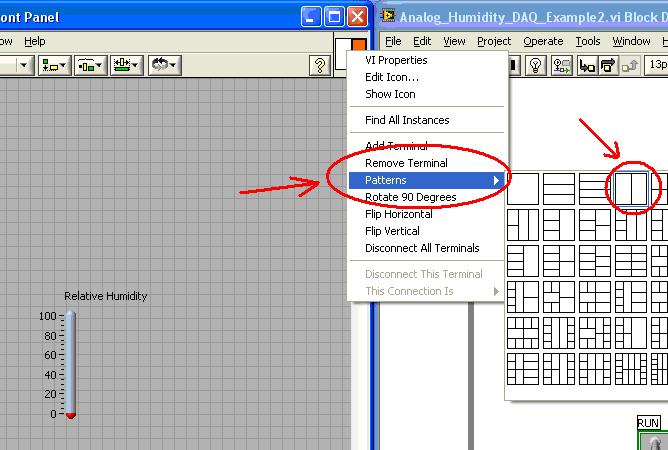
4. Right click again on the connector icon and select PATTERNS, then select
a two terminal block as shown below.
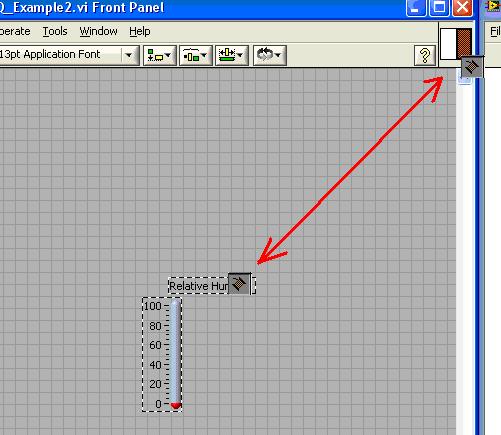
5. Next, On the FRONT PANEL, using the wiring tool, wire from the Relative
Humidity Indicator to the
RIGHT terminal as shown below (note it should change color).
6. Save the VI as RH_DAQ_SUBVI
RETURN TO THE MAIN VI
Add a Shift Register to the
loop by moving the cursor over the loop and right clicking
Add four additional Elements
to the Shift Register by right clicking while the cursor is over the loop
and select ADD ELEMENT
Add a Wait (ms) function to
the Block Diagram as shown and make it so that the loop iterates every
1/2 second
Add a Waveform Chart to the
Front Panel
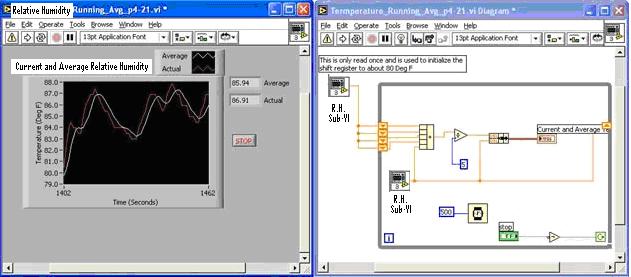
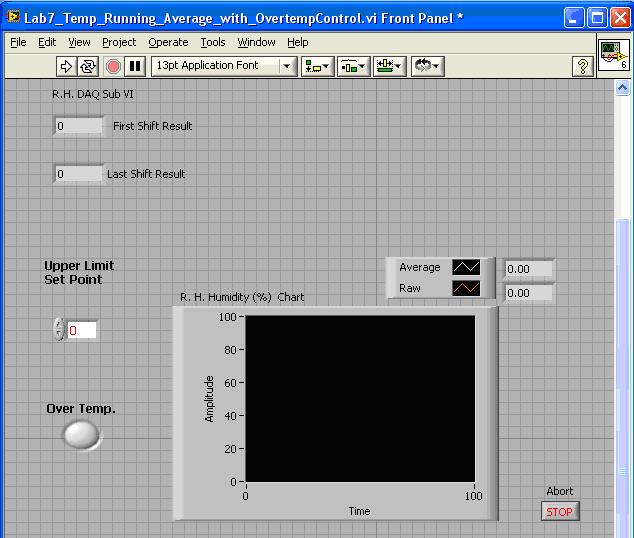
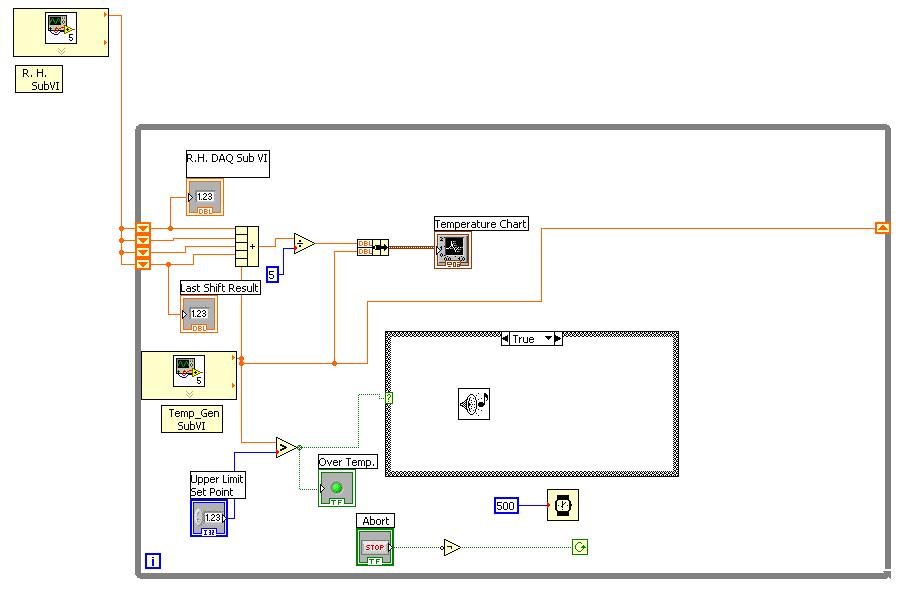
Your completed Block Diagram
and Front Panel should look like the ones shown below:
R. H. Data Acquisition Front Panel
R. H. Data Acquisition Block Diagram
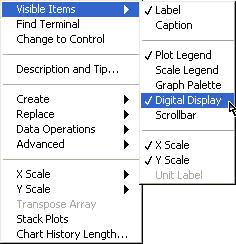
o Add the Waveform Chart's
Digital Displays by selecting the Waveform Chart > pop-up > Visible Items
>Digital Display:
Add Free Labels to the
Waveform Graph Digital Displays
o Select
the Edit Text Tool on the Tools Palette > select the location for the text
next to the digital displays > type the
text>click Automatic Tool Selection on the Tools Palette
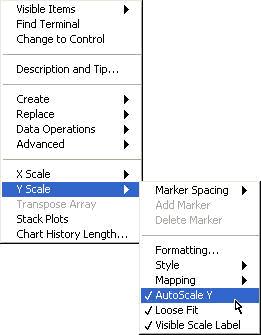
Modify the X and Y scale Label
and Waveform Chart Label text to read as shown in the above example
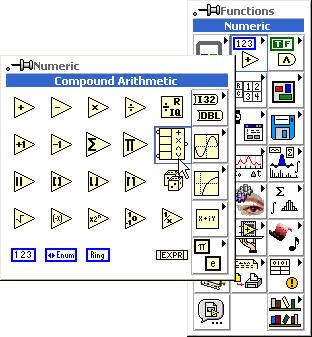
Add a Compound Arithmetic
function to the Block Diagram and Expand it to have five Inputs
o Pop-up
in the Block Diagram > Functions > Numeric > Compound Arithmetic
o Drag and stretch the Compound
Arithmetic icon to include more inputs:
Add a Divide Function and wire
a Numeric Constant with a value of five to the loop
Add a Bundle Function to the
Block Diagram
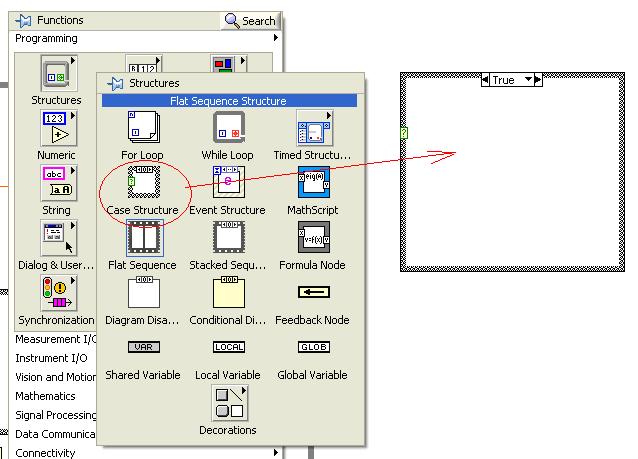
Add a CASE STRUCTURE with
TRUE as shown. (Note right click on the block diagram and select
from STRUCTURES
then select CASE
STRUCTURE.
Add an audible sound indicator inside the CASE STRUCTURE as shown below.
Complete the wiring as
shown in the above example
Run the VI and observe the
results
Save the VI as Humidity_Running_Average.vi
The next section describes how to add a write to spreadsheet function so that acquired data can be exported to Excel.
Write To Spreadsheet File
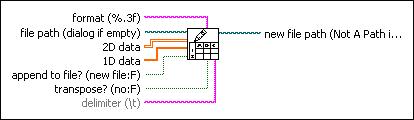
Purpose: The WRITE TO SPREADSHEET FILE function provides the ability to output data that can be written to spreadsheets such as EXCEL. For this part of the laboratory, the function will be added to the previously written VI.
Background and format for writing
a DOUBLE PRECISION variable to an EXCEL compatible format:
The WRITE TO SPREAD SHEET FILE
converts a 2D or 1D array of strings, signed integers, or double-precision
numbers to a text string and writes the string to a new byte stream file
or appends the string to an existing file. The data type you wire to the
2D data input or 1D data input determines the polymorphic instance to use.
You also can transpose the data. The VI opens or creates the file before
writing to it and closes it afterwards. You can use this VI to create a
text file readable by most spreadsheet applications.
Double
![]() format specifies how
to convert the numbers to characters. If the format is %.3f (default),
the VI creates a string long enough to contain the number, with three digits
to the right of the decimal point. If format is %d, the VI converts the
data to integer form using as many characters as necessary to contain the
entire number. Use the format string syntax.
format specifies how
to convert the numbers to characters. If the format is %.3f (default),
the VI creates a string long enough to contain the number, with three digits
to the right of the decimal point. If format is %d, the VI converts the
data to integer form using as many characters as necessary to contain the
entire number. Use the format string syntax.
![]() file path is the path
name of the file. If file path is empty (default) or is <Not A Path>,
the VI displays a dialog box from which you can select a file. Error 43
occurs if you cancel the dialog box.
file path is the path
name of the file. If file path is empty (default) or is <Not A Path>,
the VI displays a dialog box from which you can select a file. Error 43
occurs if you cancel the dialog box.
![]() 2D data contains the
data the VI writes to the file if 1D data is not wired or is empty.
2D data contains the
data the VI writes to the file if 1D data is not wired or is empty.
![]() 1D data contains the
data the VI writes to the file if this input is not empty. The VI converts
the 1D array into a 2D array before proceeding. If transpose? is FALSE,
each call to this VI creates a new line or row in the file.
1D data contains the
data the VI writes to the file if this input is not empty. The VI converts
the 1D array into a 2D array before proceeding. If transpose? is FALSE,
each call to this VI creates a new line or row in the file.
![]() If append to file? is
TRUE, the VI appends data to an existing file. If append to file? is FALSE
(default), the VI replaces data in an existing file. If there is no existing
file, the VI creates a new file.
If append to file? is
TRUE, the VI appends data to an existing file. If append to file? is FALSE
(default), the VI replaces data in an existing file. If there is no existing
file, the VI creates a new file.
![]() If transpose? is TRUE,
the VI transposes the data after converting it from a string. The default
is FALSE.
If transpose? is TRUE,
the VI transposes the data after converting it from a string. The default
is FALSE.
![]() delimiter is the character
or string of characters to use to separate fields in the spreadsheet file.
For example, a value of , specifies a single comma as the delimiter. The
default is \t, which specifies a single tab character as the delimiter.
delimiter is the character
or string of characters to use to separate fields in the spreadsheet file.
For example, a value of , specifies a single comma as the delimiter. The
default is \t, which specifies a single tab character as the delimiter.
![]() new file path returns
the path to the file.
new file path returns
the path to the file.
Procedure:
1. Open the previously created VI used to acquire temperature data. Remember this laboratory exercise incorporated SHIFT REGISTERS and provided a means to average 5 points then plot both raw and averaged values to a WAVEFORM CHART. An example is shown on the following page.
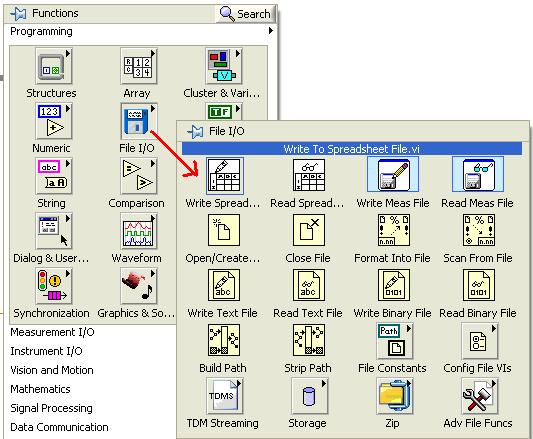
2. Under FUNCTIONS, FILE I/O, select the WRITE TO SPREADSHEET options and place inside the while loop. Note the function location is shown below.
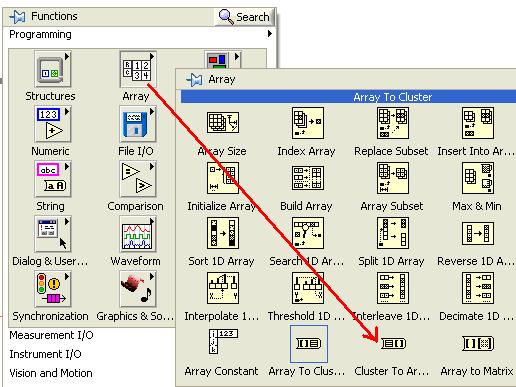
3. From FUNCTIONS, ARRAY, select the CLUSTER TO ARRAY FUNCTION
And drag inside the while loop. The location of this
function is shown below.
4. Add a BOOLEAN (TRUE) constant inside the while loop.
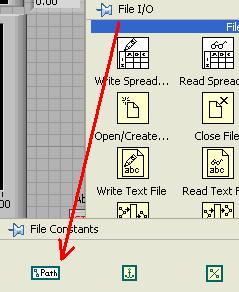
5. Add a PATH constant inside the while loop (location is shown
below).
6. Wire the BLOCK DIAGRAM (an example is shown below):
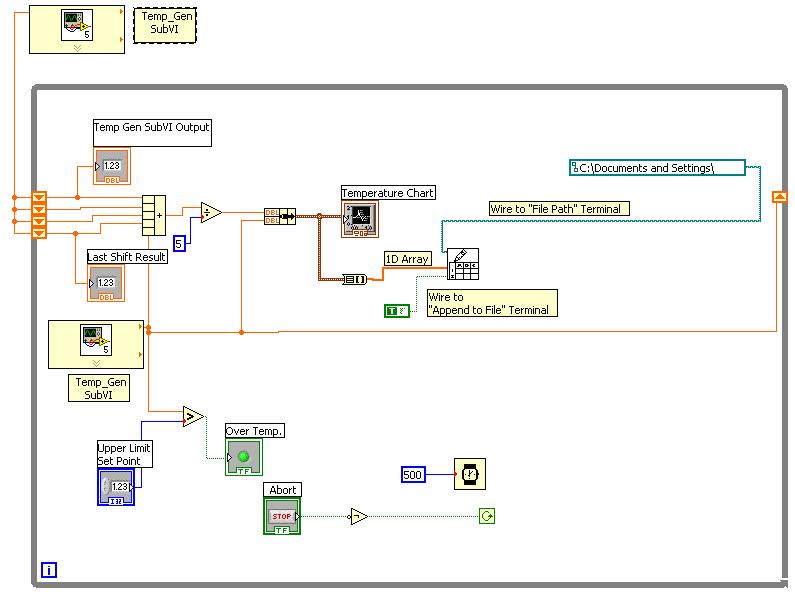
7. Type in the desired path in the PATH CONSTANT box. Note
this example in the PATH BOX contains the following path:
C:\Documents and Settings\ballaaron\My Documents\ET 472_SP09\LabView_Temp_Running_Average_with_Overtemp_Control\Tempdata
NOTE: Tempdata is the spreadsheet file name to be written to.
8. Run the VI for a few seconds (allow enough time to collect data).
9. Find the file in the folder or path specified, and open with
Excel
10. Verify that data is present in the Excel file. Note:
Alternately, you can add the .XLS file extension to your file name so that
it will be associateD with EXCEL.
11. Write a lab report showing screen captures of your front panel,
block diagram and Excel file Containing the collected data.